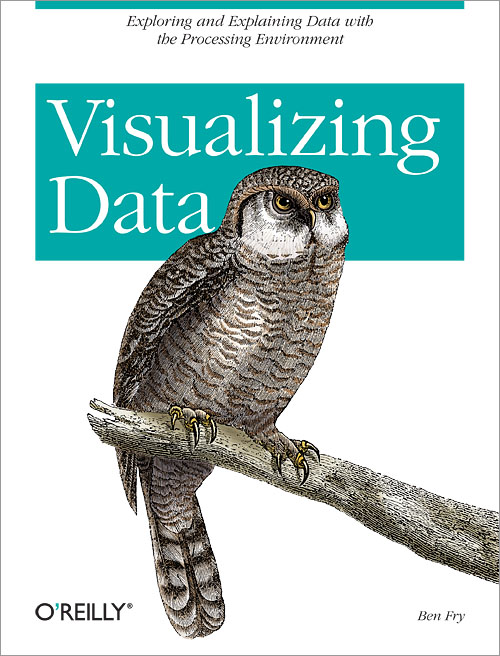
Ben Fry: Visualizing Data (2008)
Filed under manual | Tags: · code, data visualisation, design, processing, programming

How you can take advantage of data that you might otherwise never use? With the help of the free software programming environment called Processing, this book helps you represent data accurately on the Web and elsewhere, complete with user interaction, animation, and more. You’ll learn basic visualization principles, how to choose the right kind of display for your purposes, and how to provide interactive features to design entire interfaces around large, complex data sets.
Enormous quantities of data go unused or underused today, simply because people can’t visualize the quantities and relationships in it. Using a downloadable programming environment developed by the author, Visualizing Data demonstrates methods for representing data accurately on the Web and elsewhere, complete with user interaction, animation, and more.
How do the 3.1 billion A, C, G and T letters of the human genome compare to those of a chimp or a mouse? What do the paths that millions of visitors take through a web site look like? With Visualizing Data, you learn how to answer complex questions like these with thoroughly interactive displays. We’re not talking about cookie-cutter charts and graphs. This book teaches you how to design entire interfaces around large, complex data sets with the help of a powerful new design and prototyping tool called “Processing”.
Used by many researchers and companies to convey specific data in a clear and understandable manner, the Processing beta is available free. With this tool and Visualizing Data as a guide, you’ll learn basic visualization principles, how to choose the right kind of display for your purposes, and how to provide interactive features that will bring users to your site over and over. This book teaches you:
* The seven stages of visualizing data — acquire, parse, filter, mine, represent, refine, and interact
* How all data problems begin with a question and end with a narrative construct that provides a clear answer without extraneous details
* Several example projects with the code to make them work
* Positive and negative points of each representation discussed. The focus is on customization so that each one best suits what you want to convey about your data set
The book does not provide ready-made “visualizations” that can be plugged into any data set. Instead, with chapters divided by types of data rather than types of display, you’ll learn how each visualization conveys the unique properties of the data it represents — why the data was collected, what’s interesting about it, and what stories it can tell. Visualizing Data teaches you how to answer questions, not simply display information.
Publisher O’Reilly Media, Inc., 2008
ISBN 0596514557, 9780596514556
Length 366 pages
Wolfgang Lefèvre (ed.): Picturing Machines 1400-1700 (2004)
Filed under book | Tags: · architecture, data visualisation, drawing, engineering, geometry, history of science, history of technology, media archeology, science, technology

“Technical drawings by the architects and engineers of the Renaissance made use of a range of new methods of graphic representation. These drawings—among them Leonardo da Vinci’s famous drawings of mechanical devices—have long been studied for their aesthetic qualities and technological ingenuity, but their significance for the architects and engineers themselves is seldom considered. The essays in Picturing Machines 1400-1700 take this alternate perspective and look at how drawing shaped the practice of early modern engineering. They do so through detailed investigations of specific images, looking at over 100 that range from sketches to perspective views to thoroughly constructed projections.
In early modern engineering practice, drawings were not merely visualizations of ideas but acted as models that shaped ideas. Picturing Machines establishes basic categories for the origins, purposes, functions, and contexts of early modern engineering illustrations, then treats a series of topics that not only focus on the way drawings became an indispensable means of engineering but also reflect the main stages in their historical development. The authors examine the social interaction conveyed by early machine images and their function as communication between practitioners; the knowledge either conveyed or presupposed by technical drawings, as seen in those of Giorgio Martini and Leonardo; drawings that required familiarity with geometry or geometric optics, including the development of architectural plans; and technical illustrations that bridged the gap between practical and theoretical mechanics.”
Publisher MIT Press, 2004
ISBN 0262122693, 9780262122696
347 pages
PDF (updated on 2019-12-2)
Comment (0)Jack Ox, Jeremy Hight, Erik Champion (eds.): LEA Special Issue: Creative Data (2009)
Filed under journal | Tags: · data visualisation, immersion, mapping
The Creative Data special issue features papers and artworks that deal with the emerging practice of data visualization as an immersive experience. Data has long been the property and domain of screen-based collection, archiving, processing and interaction. The emergence of new processes, functionality and ways of interacting with information is opening up several new areas of great possibility in which the data allows newfound thematic and engaging forms of immersion, as well as innovative and perception-reshaping interaction. Consider a simple analogy; to swim in a pool is to understand three-dimensionality, interaction, spatial relationships and a macro-micro view, as well as contextual and embodied interaction. Can we swim with data? How do we build, debate and discuss the future and shape of immersivity in its relation to data? Can the representation of data as an immersive environment be considered a creative accomplishment or support creativity in action or as spectacle? How does this change the way we collect and archive information? How does it relate to our ways of interacting with information in study and analysis? How can this enhance or fuse key aspects of image projection, virtual reality, augmented reality, new media and even locative media?
The essays, interviews, reports and other forms of writing look at spatialization and layering of information, a greater sense of immersion, new forms of visualization and depth of field, precedents, future applications and connotations, our relationship to immersion and information inherently as how this applies to this new area.
Guest Editors: Jack Ox, Jeremy Hight, and Erik Champion
Leonardo Electronic Almanac
Vol 16 Issue 6 – 7
More info and download (PDF per article)
Comment (0)
